


18+ Please Gamble Responsibly GambleAware
Draw bias is a key factor that affects race outcomes in flat horse racing. It refers to how a horse’s starting stall position can influence its chances of winning, especially on courses where the layout favours certain draw positions. Understanding draw bias can help gamblers make more informed decisions.
This guide explains how draw bias works in relation to betting on horse racing. It highlights how it plays out at major UK tracks, including York, Ascot, Beverley, Doncaster, Southwell, and Wolverhampton. Each course has unique characteristics that can create a consistent draw advantage or disadvantage. For example, York draw bias is known to favour low numbers in certain races, while Wolverhampton draw bias can vary depending on distance and pace.
We’ll break down what causes this bias, how to spot it, and how to use it to improve your betting strategy. Whether you’re looking into Ascot draw bias for the royal meeting or want to understand draw bias for the Glorious Goodwood Festival, this guide offers practical insights based on track layout, data, and past results.
By the end, you’ll know how to assess biases clearly and apply it bets placed on flat course races.
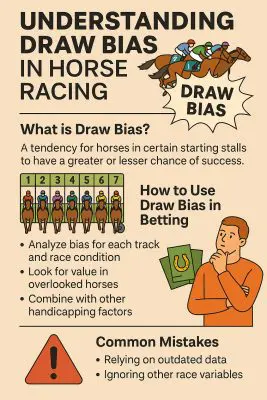
What Is Draw Bias?
 Draw bias refers to the advantage or disadvantage a horse may have based on its starting stall position in flat racing. In races with a bend shortly after the start or a narrow track layout, certain stalls—often those closer to the inside rail—can offer a better racing line. This positional benefit can lead to faster times and a higher chance of success.
How It Works
In most flat races, horses are assigned a stall number through a random draw. This number determines where they start relative to the rail. On tracks with turns, horses drawn closer to the inside rail often cover less ground. This can be a clear advantage, especially in short-distance sprints or on tight courses.
How Draw Bias Emerges
Draw bias emerges from the physical layout of a racecourse and how it interacts with race conditions. It is not created artificially; it develops naturally based on how certain stall positions perform over time.
Understanding how biases form helps explain why some horses are favoured purely by where they start. Below are the key factors that lead to draw bias in flat racing:
- Track Layout
The shape of a course is the most common source of draw bias. On tight, turning tracks like Chester or Beverley, low-drawn horses have a shorter route around the bend. This gives them a positional advantage early in the race.
On straight tracks like Ascot or Newmarket, bias can occur due to differences in ground condition across the width of the course.
- Start Position and First Turn
The location of the starting stalls relative to the first bend is critical. If a turn comes quickly after the start, horses drawn wide must use more energy to get a good position or risk running wider and covering more ground.
For example, in sprint races at the Doncaster St Ledger Festival, the position of the bend and rail alignment can influence which side has the advantage.
- Distance of the Race
Bias is usually stronger in shorter races. In 5- or 6-furlong sprints, the race can be over before horses have time to adjust position. A good draw can be decisive. In longer races, horses have more time to settle and shift across, reducing the impact of any bias.
At York, for instance, low draws are often favoured in sprint races up to 7 furlongs, where the first furlong includes a sweeping bend.
- Ground Conditions
Rain and watering can change which parts of the track are quicker. On soft or heavy ground, horses may avoid the inside rail if it becomes churned up. This can reverse or weaken a usual bias.
For example, Ascot draw bias may shift to the far side or stands’ side, depending on rainfall and how the track drains.
- Field Size
Larger fields make it harder for wide-drawn horses to find a good position. In a 20-runner handicap, being drawn on the outside can mean traffic issues or forced wide runs, making a strong draw bias more likely.
Small fields reduce the effect, as all horses have space and less interference.
- Pace and Running Style
Front-runners benefit more from a good draw. If a horse likes to lead and is drawn near the rail, it can take control early and dictate the pace. This is common in races at Southwell or Wolverhampton, where early speed on the all-weather surface plays a big role.
Draw bias is not random. It emerges from repeatable race patterns shaped by course design, conditions, and competition. The next section will explore how these patterns play out at specific UK tracks like York, Doncaster, and Ascot, where historical data shows clear draw-related trends.
Example: Inside vs Outside Stalls
On a left-handed course like Chester, a horse drawn low (close to the inside rail) over 5 furlongs is more likely to gain an early lead and hold position. This is a clear draw bias in favour of low numbers.
Conversely, on straight tracks like the Rowley Mile at Newmarket, draw bias can swing depending on wind direction and ground wear—sometimes favouring high draws or the stands’ side.
In the following sections, we’ll look at how draw bias applies to specific UK racecourses.
Track-Specific Biases
Biases are not the same at every racecourse. Each track has a unique layout, surface, and set of conditions that influence how stall positions affect race outcomes. Below is a breakdown of track-specific biases at major UK flat racing venues, including key patterns and distances where it can be most noticeable.
York
York draw bias is well-documented, especially over sprint distances. On the straight course (5f and 6f), low numbers often hold an advantage. Horses drawn near the far rail (low) benefit from a straighter path and often better ground conditions in large fields.
- Best bias: 5f–6f, especially in big-field handicaps.
- Low draw advantage: Particularly strong when ground is quick.
- Example: In the Ebor Festival, low numbers regularly outperform in sprints.
Ascot
Ascot draw bias is variable due to the wide, straight course used for races up to a mile. The bias shifts depending on the ground. On quick ground, the stands’ side (high draw) often holds an edge. On softer going, runners can favour the far side.
- Best bias: 7f–1m on the straight course.
- High or low: Depends on watering and rainfall.
- Example: At Royal Ascot, the Hunt Cup has shown a bias towards high draws in dry years.
Beverley
Beverley draw bias is one of the strongest in the UK. Over 5 furlongs, the sharp right-handed bend shortly after the start gives a clear edge to low-drawn runners.
- Best bias: 5f – strong bias to low stalls.
- Low draw advantage: Very consistent, especially in large fields.
- Example: Horses drawn 1–3 at Beverley in 5f handicaps often dominate.
Doncaster
Doncaster draw bias can shift, but trends show certain advantages over time. On the straight course (5f to 1m), bias depends on the going. On fast ground, the stands’ side (high draw) can be favoured. On softer ground, the far side (low draw) may have better footing.
- Best bias: 6f–1m straight-course races.
- Variable: Changes based on track watering and rainfall.
- Example: Draw bias Doncaster was evident in past Lincoln Handicaps where high numbers held the edge.
Southwell
Southwell draw bias applies mainly on the all-weather track. Previously fibresand, now Tapeta, the layout still rewards early speed. Inside draws are helpful when front-running.
- Best bias: 5f–6f, especially on turning starts.
- Low draw + early pace: Key advantage.
- Example: A low draw at Southwell with early pace is often decisive.
Wolverhampton
Wolverhampton draw bias is subtle but can matter over shorter distances. On the Tapeta surface, inside draws help horses that lead or race prominently, particularly around the tight turns.
- Best bias: 5f–7f races on the round course.
- Low to middle draws: Preferable with a forward racing style.
- Example: Many winners over 6f at Wolverhampton come from stalls 1–5 with front-running tactics.
Understanding these track-specific draw biases lets you assess each race with more context. A strong bias at York, for instance, may justify backing a lower-priced horse with an ideal draw. Meanwhile, recognising a shift at Ascot can help avoid overvalued runners drawn on the wrong side.
Tools and Data Sources
To identify and track draw bias accurately, you need access to reliable data. While some draw trends are easy to observe, the best insights come from consistent use of race analysis tools, statistics, and race replays. Below are recommended tools and data sources for spotting bias across various race tracks.
- Racing Post – Draw Analysis: The Racing Post website offers race-by-race draw breakdowns. Each race card includes a “draw” tab showing stall performance over recent years at the same course and distance. You can view how often each stall wins and where past winners were drawn.
- Course-Specific Draw Stats (Free PDFs): Some race analysts publish free draw bias guides for big meetings like Royal Ascot or the Ebor Festival at York. These are often available as PDFs or blog posts as race weeks draw closer.
- Replays and Visual Checks: Watching race replays is still one of the best ways to spot emerging or changing draw bias. Look at where the winners were drawn, how they travelled, and whether the pace or rail played a part. You can access replays at Racing TV, Sky Sports Racing, and YouTube.
Using these tools consistently allows you to stay ahead of shifting trends. For example, by checking Wolverhampton draw bias data at Racing Post and comparing it with real-time pace maps, you can spot ideal stall positions for front-runners. At tracks like Doncaster, combining Racing Post trends with weather data helps identify draw shifts before they affect the market.
Next, we’ll show how to apply draw bias insights to real betting decisions.
How to Use Draw Bias in Betting
 Understanding draw bias is only valuable if you apply it effectively, especially for Scoop 6 or placepot betting. Knowing how to factor stall positions into your betting can give you a real edge, especially on courses like York, Doncaster, Beverley, and Wolverhampton, where positional advantage often affects the outcome.
Follow this step-by-step guide to use draw bias in a practical betting strategy.
- Check the Course and Distance: Start by identifying the course and distance of the race. Draw bias has more impact on certain distances—especially short sprints (5f–7f) on tracks with tight turns.
- Review Stall Statistics: Look up the stall performance for the specific course and distance. Use tools like Racing Post to check which stalls have a higher win or place rate.
- Assess Field Size and Race Type: Draw bias tends to be stronger in large fields and handicap races, where positioning is more competitive. In smaller fields, stall positions matter less.
- Consider Ground Conditions: Check the going. On soft or heavy ground, bias may shift due to drainage patterns or ground wear.
- Match Draw With Running Style: Look for horses whose running style suits their draw. Front-runners drawn low on a turning track can grab the lead and control the pace.
- Watch Market Movements: Late market moves can indicate confidence in a horse with a favourable draw. Track these shifts and combine them with your analysis.
Practical Example
Race: 5f Handicap at Beverley
- Ground: Good
- Field Size: 14
- Bias: Strong to low draws
- Top pick: Horse in stall 2 with early pace and strong form
- Reason: Matches track bias, race setup, and running style
Applying draw bias to your betting isn’t about blindly backing low numbers. It’s about combining stall data with pace, ground, type of race, and context. In the next section, we’ll highlight common mistakes to avoid when using it in your race analysis.
Common Mistakes
There’s no doubting that identifying bias can be a powerful tool, but only when used correctly. Many punters make avoidable errors that lead to false conclusions or poor betting choices. Below are the most common mistakes people make when interpreting draw bias.
- Overreacting to Small Sample Sizes
One of the biggest errors is assuming a biases exist based on just one or two races. A couple of wins from a single stall can be coincidence rather than a trend.
- Correct approach: Look at long-term data over multiple seasons, focusing on races of the same distance and type.
- Ignoring Ground Conditions
Track bias can shift depending on the going. A stall that is usually favoured on good ground might become disadvantaged on soft ground due to drainage or wear patterns.
- Example: Doncaster draw bias can swing from high to low depending on rainfall. Always check the going before relying on historic bias.
- Failing to Account for Rail Movements
Courses often move rails to protect worn ground. These rail shifts can change how a race plays out and reduce or even reverse established draw bias.
- Tip: Watch pre-race coverage or check racecourse updates to see if rail positions have changed.
- Ignoring Running Style
A good draw only helps if the horse has the right running style. A slow starter in a perfect stall may still end up boxed in or lose early position.
- Correct approach: Match the draw with a horse’s tactical speed. At Southwell or Wolverhampton, front-runners from low draws are ideal.
- Treating All Tracks the Same
Each course behaves differently. What works at Beverley over 5f won’t apply to Ascot over a mile. Draw bias must be analysed per track and per race type.
- Reminder: Use course-specific data and never generalise across racecourses.
- Outdated Assumptions
Track surfaces change over time. For example, Southwell switched from fibresand to Tapeta in 2021, which reduced some previous low-draw bias patterns.
- Tip: Use up-to-date tools and filter draw data by surface type and year.
- Chasing Bias in the Wrong Races
Bias is less important in long-distance races or in small fields, where horses can switch positions more easily.
- Better strategy: Focus on sprints (5f–7f) with 10+ runners where draw position has more influence.
By avoiding these mistakes, you can use draw bias more effectively in your race analysis and betting strategy. Recognise that bias is one part of a larger puzzle. Combine it with racing form, pace, ground, and race type for smarter betting decisions.
Final Thoughts on Draw Bias in Horse Racing
Draw bias plays a major role in flat racing, especially on tracks where stall position can significantly affect race outcomes. By understanding how bias emerges and knowing which courses show consistent patterns, you can improve your betting and possibly spot value that others miss.
We’ve outlined how to recognise biases, use the right tools, avoid common mistakes, and apply track-specific insights at key venues like York, Doncaster, Southwell, and Wolverhampton.
Always remember: draw bias should support your analysis, not replace it. Combine it with other pre-race analysis such as form, pace, and conditions for a complete view.
Draw Bias FAQs

Which tracks have the strongest draw bias?
racks like Beverley, York, and Doncaster often show clear draw bias patterns. Beverley has a strong low-draw bias over 5 furlongs. York draw bias also favours low numbers in sprints.
Does draw bias apply to all race distances?
No. Draw bias is usually strongest in short races (5f–7f). Over longer distances, horses have more time to change position, and bias becomes less influential.
Can draw bias change over time?
Yes. Bias can change due to weather, rail movements, or surface changes. For example, Southwell draw bias shifted after the switch from fibresand to Tapeta.
Where can I check the latest draw bias data?
Use tools like Racing Post, At The Races, Geegeez Gold, and Proform Racing. These platforms provide draw statistics by course and distance.